What Core Web Vitals means
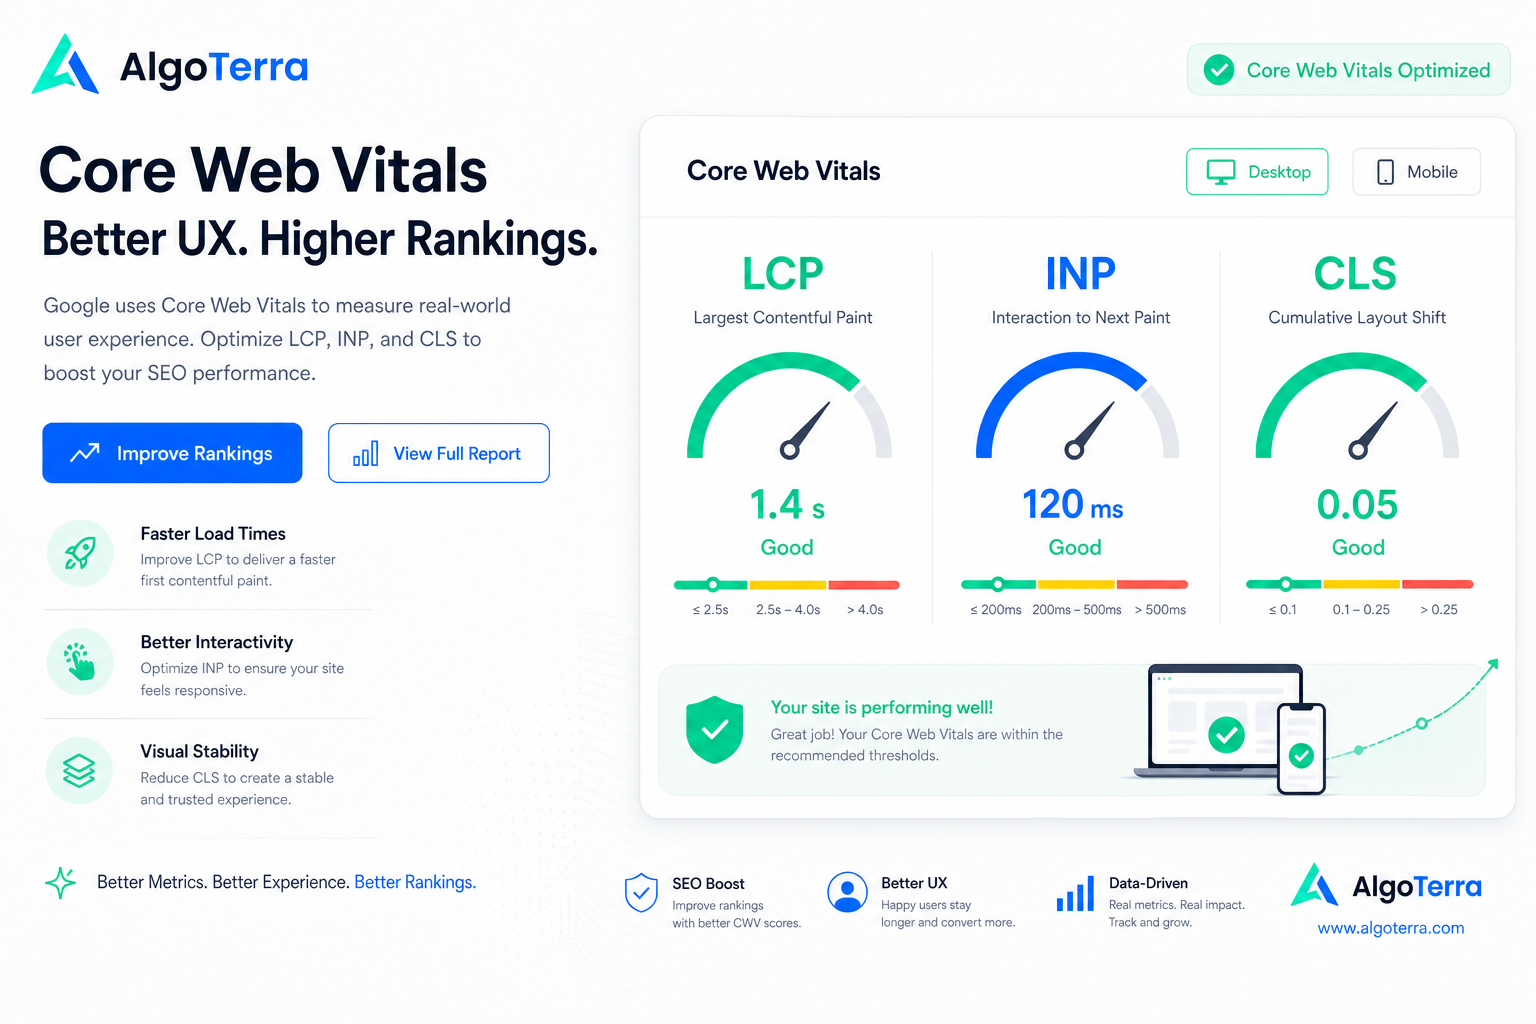
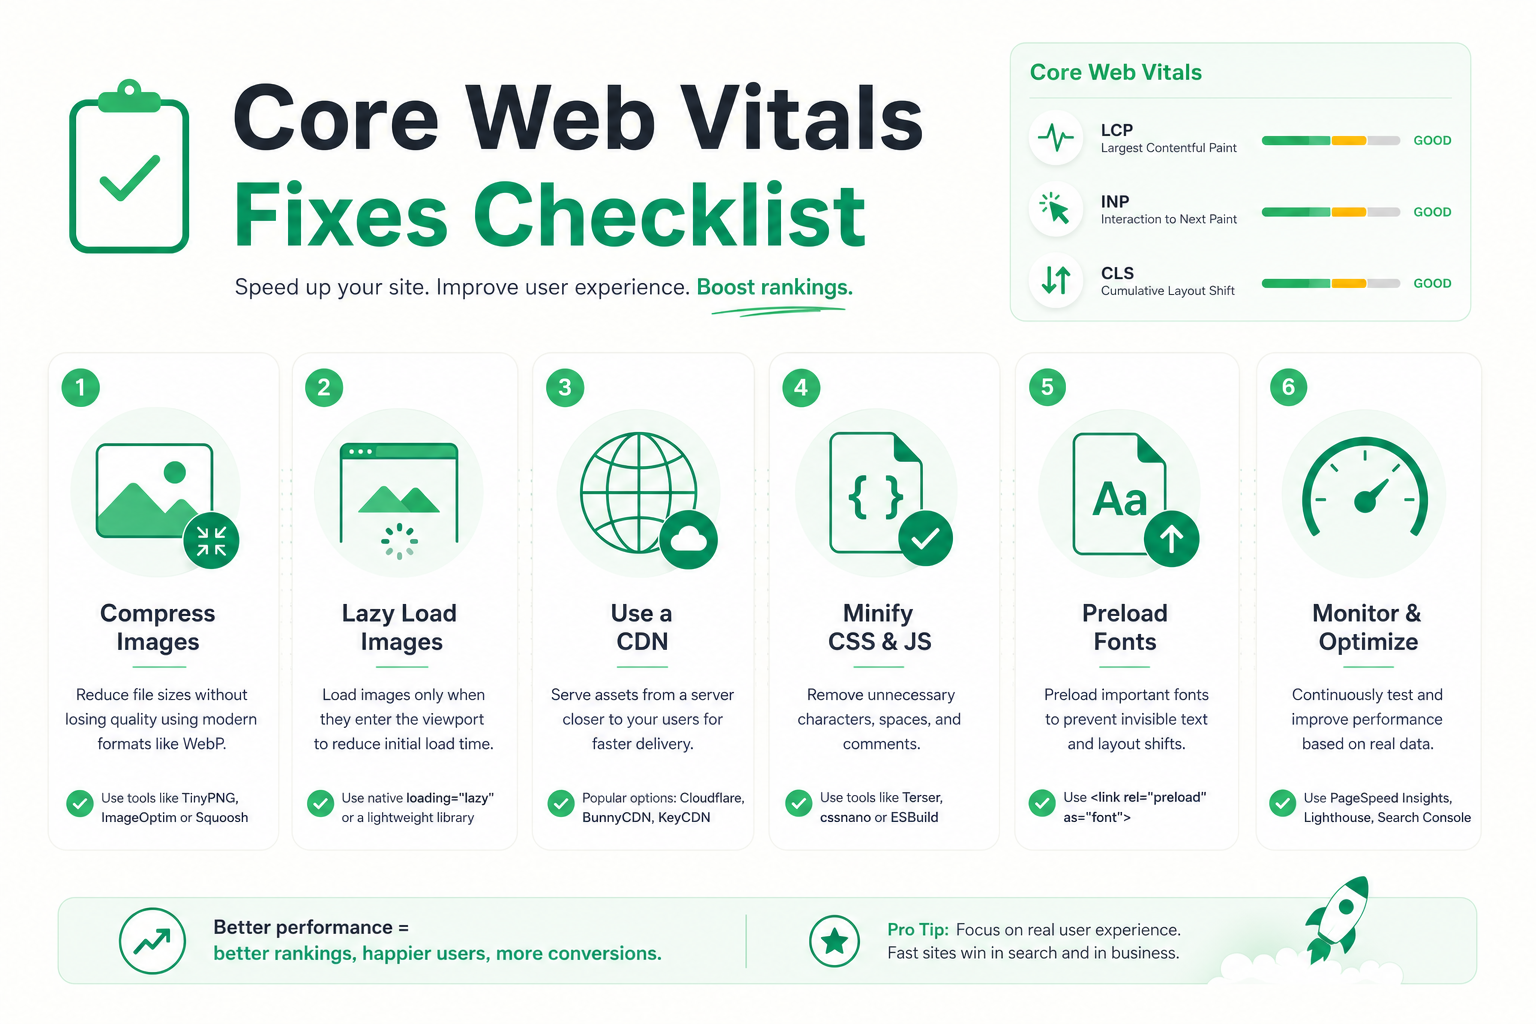
Core Web Vitals is a set of Google-defined metrics that describe site user experience from three angles: loading speed, interaction responsiveness, and visual stability. They are not abstract technical numbers — they describe how the page actually feels to a user.
The metric set is part of Google’s page experience signals and an official ranking factor. Its significance is not that good scores alone push you to the top — it is that poor scores can drag down an otherwise earned ranking and drive users away.
In 2026 the three core metrics are LCP (Largest Contentful Paint), INP (Interaction to Next Paint), and CLS (Cumulative Layout Shift). INP replaced the older FID metric because it captures responsiveness across the whole page lifecycle, not just the first interaction.
We cover each metric separately: what it measures, what counts as a good threshold, and which fixes actually move the number. At the end you get a concrete checklist to run before your next release.
Why this matters
LCP — how fast the main content appears
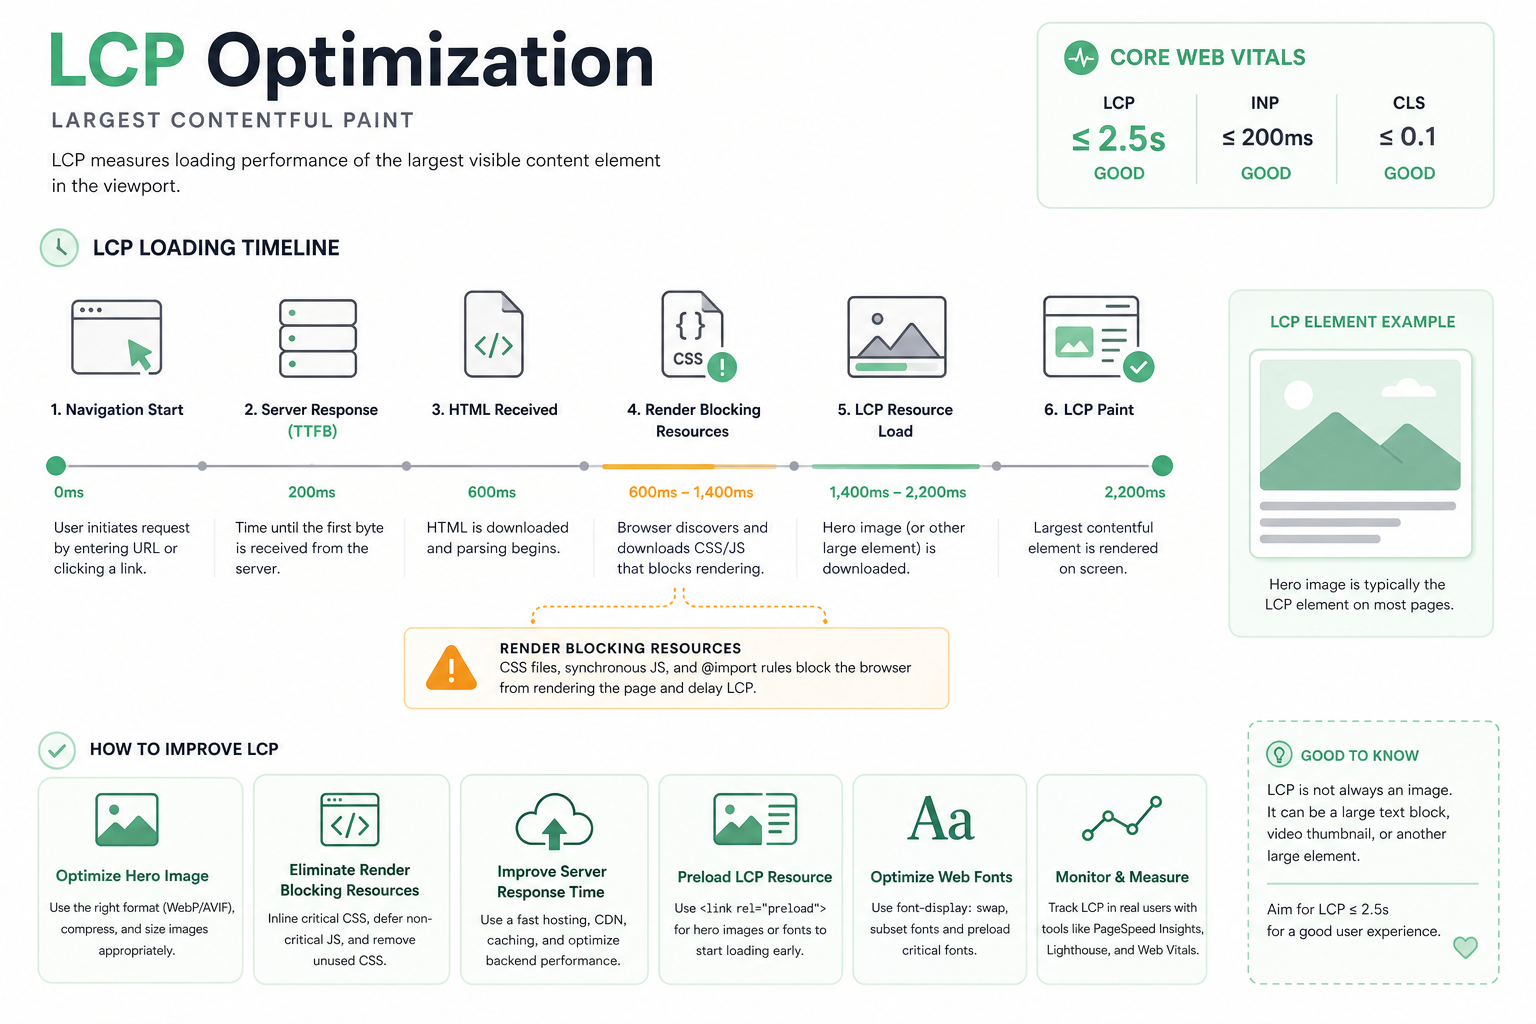
LCP (Largest Contentful Paint) measures how long it takes for the largest visible element on the page — usually a hero image, heading, or large text block — to render. It is the best single indicator of perceived loading speed.
A good LCP is under 2.5 seconds, 2.5–4 seconds needs improvement, and over 4 seconds is poor. The measurement runs from when the user navigates to the page until the largest element is painted on screen.
Slow LCP usually stems from slow server response, render-blocking resources (CSS/JS), unoptimized images, or client-side rendering that delays content appearing.
- Good: under 2.5 s — Needs work: 2.5–4 s — Poor: over 4 s
- Most common LCP element: hero image or main heading
- Biggest causes: slow TTFB, heavy images, blocking JS/CSS
- Always measure on mobile — the numbers are tightest there
INP — how responsive the page is
INP (Interaction to Next Paint) measures the delay between a user interaction (click, keypress, tap) and the visual response that follows. It captures how "laggy" the page feels in use.
INP replaced the FID metric in 2024 because it accounts for all interactions across the whole session, not just the first. This gives a more realistic picture of how using the page actually feels.
A good INP is under 200 milliseconds. The biggest culprit behind a poor INP is heavy JavaScript that blocks the main thread and prevents the browser from responding quickly to user actions.
- Good: under 200 ms — Needs work: 200–500 ms — Poor: over 500 ms
- Measures all session interactions, not just the first
- Main cause: heavy JavaScript and long tasks on the main thread
- Fix: break up long tasks, defer non-critical JS
CLS — how stable the layout is
CLS (Cumulative Layout Shift) measures how much page elements jump around during loading. Anyone who has tried to click a button that moves just before the click knows why this matters.
A good CLS is under 0.1. Layout shifts are caused by images and ads without reserved space, dynamically loaded content, and web fonts that change text size during load.
CLS is often the easiest metric to fix: reserve fixed dimensions for images and ads, load fonts in a controlled way, and avoid pushing content down during loading.
- Good: under 0.1 — Needs work: 0.1–0.25 — Poor: over 0.25
- Reserve width/height or aspect-ratio for images
- Reserve space for ads and embeds in advance
- Use font-display: optional/swap to prevent font shifts
How to measure: field data vs. lab data
Core Web Vitals is measured two ways, and the difference matters. Field data (CrUX) is collected from real Chrome users over 28 days. This is the data Google uses for rankings.
Lab data is produced in a simulated environment with a single measurement. It is useful for debugging and reproducible, but it does not tell you how the page feels to real users on different devices and connections.
Use field data to see where the real problem is, and lab data to diagnose and test fixes. Do not optimize a lab number alone if field data tells a different story.
- Field data (CrUX): real users, 28 days — affects rankings
- Lab data: simulated, reproducible — for debugging
- Rankings depend on field data, not the lab number
- Optimize for the field, diagnose in the lab
Measurement tip
PageSpeed Insights and other tools
PageSpeed Insights is Google’s free tool that shows both field and lab data on one page. It gives concrete recommendations and estimates the impact of each fix.
Lighthouse (in Chrome DevTools) produces the same lab analysis locally and suits development-stage testing. The Web Vitals browser extension shows metrics in real time as you browse a page.
For more advanced monitoring, add continuous RUM (Real User Monitoring) that collects Core Web Vitals data from your own users. This lets you see trends before they appear in CrUX data with its month-long lag.
- PageSpeed Insights: field + lab + recommendations
- Lighthouse / DevTools: local debugging
- Web Vitals extension: real-time measurement
- RUM: continuous monitoring from your own users
Mobile decides — optimize there first
Google uses mobile-first indexing, meaning it primarily evaluates your mobile version. Core Web Vitals field data is weighted toward mobile devices, where connections are slower and processors weaker.
This means good desktop numbers are not enough. The same hero image that loads in a second on fiber can take four seconds on a mid-range phone over 4G.
Always test with a mobile profile and simulate a slower connection and CPU. If the numbers are good on throttled mobile, they are good everywhere.
- Mobile-first: Google evaluates your mobile version first
- Field data is weighted toward mobile devices
- Test with throttled CPU and a 4G connection
- Responsive images: srcset and the right size per device
Concrete fixes for each metric
LCP fixes start with the server: speed up TTFB with caching and a CDN. Optimize the LCP element: load the hero image with priority (fetchpriority="high"), compress it to a modern format (WebP/AVIF), and avoid lazy-loading an above-the-fold image.
INP fixes focus on JavaScript: break long tasks into smaller chunks, defer non-critical JS (defer/async), remove unused code, and move heavy computation to web workers. Less JS = a more responsive page.
CLS fixes are often the fastest: reserve fixed dimensions or aspect-ratio for images and videos, reserve space for ads in advance, load fonts with a font-display rule, and avoid inserting content above existing content.
Remove render-blocking resources: inline critical CSS, load the rest asynchronously, and minimize third-party scripts. Every blocking resource delays LCP and hurts INP. Deeper technical background is in our technical SEO guide.
- LCP: CDN + caching, fetchpriority, WebP/AVIF, no lazy-load for hero
- INP: break long tasks, defer/async, remove unused JS
- CLS: fixed image dimensions, space for ads, font-display
- General: inline critical CSS, minimize third-party scripts
Core Web Vitals impact in numbers
Common pitfalls
The most common mistake is optimizing the PageSpeed score instead of field data. The score is a lab number — the real ranking impact comes from field data, which can tell an entirely different story.
A second pitfall is underestimating third-party scripts: chat widgets, analytics, ad networks, and A/B testing tools accumulate and clog the main thread. Audit them regularly and remove the unnecessary ones.
A third is one-off optimization. Core Web Vitals degrades over time as new features and scripts are added. Make it continuous monitoring, not a one-time project.
- Don’t optimize the score alone — field data decides
- Audit third-party scripts regularly
- Do continuous monitoring, not a one-off project
- Remember mobile — a good desktop number is not enough
Core Web Vitals checklist
Run this list before your next release or major change. It covers all three metrics in priority order.
Once the speed foundation is solid, continue to on-page SEO and technical SEO. Need help? Explore our SEO service.
- LCP under 2.5 s on mobile — hero image optimized and prioritized
- INP under 200 ms — JavaScript reduced and chunked
- CLS under 0.1 — space reserved for images and ads
- Field data green in Search Console across all page groups
- Third-party scripts audited and minimized
- Critical CSS inlined, the rest loaded asynchronously
- Continuous RUM or Search Console monitoring in place
Frequently asked questions
What does Core Web Vitals mean?
Core Web Vitals is Google’s set of metrics for site user experience. It consists of three metrics: LCP (loading speed), INP (responsiveness), and CLS (visual stability). The metric set is an official ranking factor.
What are good Core Web Vitals values?
The good thresholds are: LCP under 2.5 seconds, INP under 200 milliseconds, and CLS under 0.1. At least 75% of page visits should pass these thresholds for the page to count as "good".
Does Core Web Vitals affect SEO rankings?
Yes. Core Web Vitals is part of Google’s page experience signals and an official ranking factor. Poor values can drag down rankings, but great content is still the most important factor — speed is decisive in close calls.
What is INP and how does it differ from FID?
INP (Interaction to Next Paint) measures the delay between an interaction and the visual response across the whole session. It replaced the FID metric in 2024 because it accounts for all interactions, not just the first.
How do I measure Core Web Vitals?
Use PageSpeed Insights to see field and lab data, the Google Search Console Core Web Vitals report to monitor page groups, and Lighthouse for local debugging. Always optimize based on field data.