What Google Search Console is
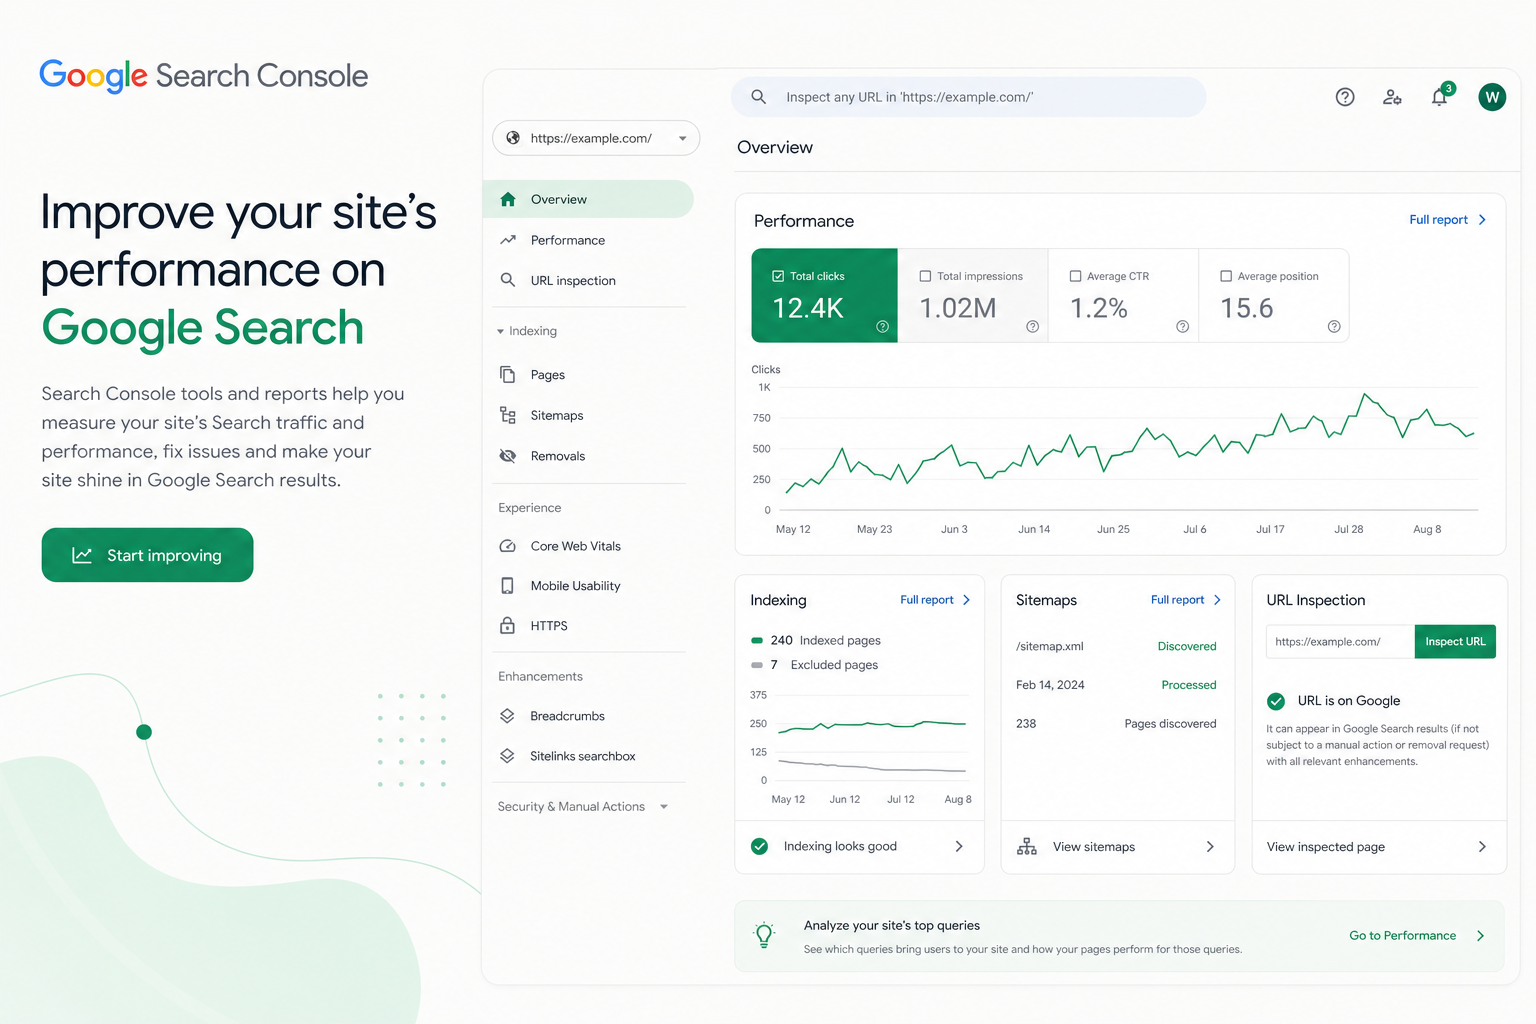
Google Search Console is a free service that shows how your site appears and performs in Google Search. Unlike Google Analytics, which measures visitor behavior on the site, GSC focuses on what happens before the click: in search results.
GSC tells you which queries your site appears for, how often it is clicked, which pages are indexed, and whether there are technical problems. It is a direct communication channel with Google: you can submit sitemaps, request indexing, and get notifications about issues.
Every SEO project should start with setting up Search Console. Without it, you optimize on guesswork — GSC gives you real data on what Google responds to and where there is room to improve.
This guide moves from setup to the most important reports: performance, indexing, sitemaps, and URL inspection. At the end is a checklist for regular use.
Setup and ownership verification
The first step is adding your site to Search Console and verifying ownership. GSC offers two options: a Domain property (covers all subdomains and protocols) and a URL prefix property (covers one exact address).
We recommend the Domain property because it collects all data in one place regardless of whether the visitor uses the www or non-www version, or the http or https protocol. Verification is done with a DNS record.
The URL prefix is faster to verify (e.g., an HTML file, meta tag, or Google Analytics connection), but it only covers one version of the address. If in doubt, choose the Domain property.
- Domain property: all subdomains + protocols (DNS verification)
- URL prefix: one exact address (HTML/meta/GA verification)
- Recommendation: Domain property for coverage
- After verification, data starts accruing within a few days
Setup tip
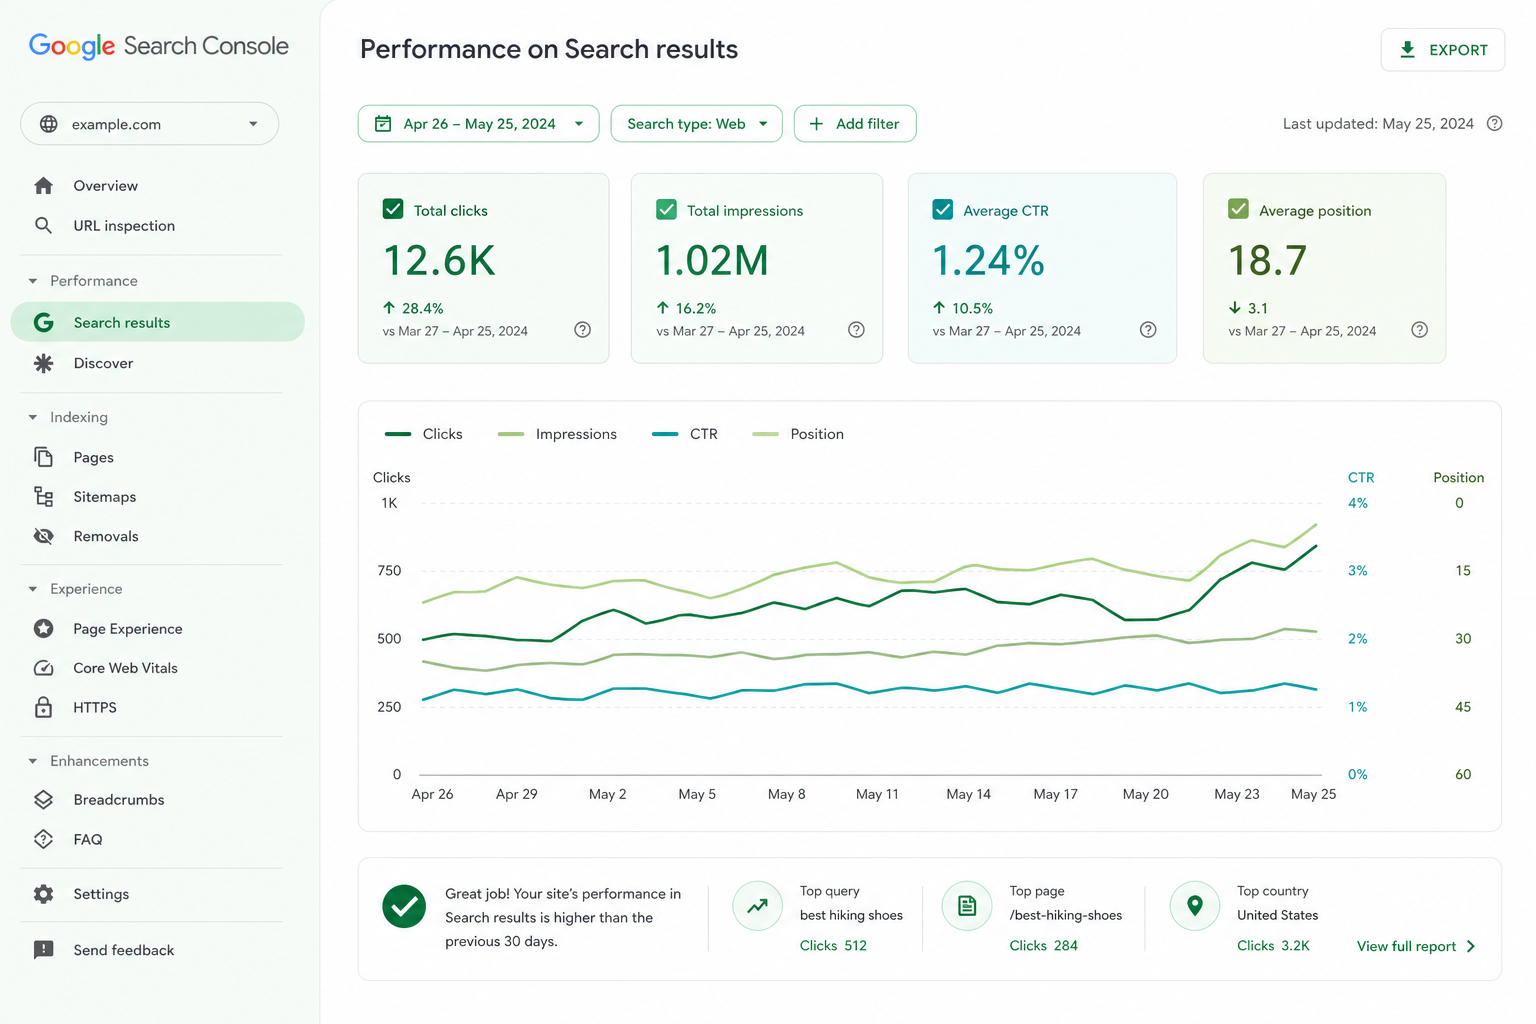
Performance report — the most important view
The Performance report is the heart of Search Console. It shows which queries your site appears for in search, how many times it was shown, how many clicks it earned, and at what average position.
You can filter the data by query, page, country, device, and search type, and compare time periods. This reveals which content works, which queries bring traffic, and where the growth potential is.
Especially valuable is combination analysis: filter one page and see which queries it appears for. You will often find queries where the page shows on page 2 — a little optimization can lift these to page 1.
- Shows: queries, impressions, clicks, CTR, average position
- Filter: query, page, country, device, search type
- Compare time periods to see trends
- Find page-2 queries — the easiest growth
Four key metrics and what they tell you
Impressions tell you how many times your site appeared in search results. Rising impressions mean expanding visibility — but only clicks bring visitors.
Clicks reflect the real traffic from search. The ratio of clicks to impressions is the CTR (click-through rate). A low CTR at a high position means your title and meta description are not attractive — worth improving.
Average position shows where your site appears on average for queries. Interpret the metrics together: high position + low CTR = improve titles; low position + many impressions = improve content and links.
- Impressions: the breadth of visibility in search
- Clicks: the real traffic from search
- CTR: how attractive the result is (title + meta)
- Average position: the average spot for queries
Index status — are your pages in Google
The Pages report (formerly Coverage) shows which pages Google has indexed and which it has left out. If a page is not indexed, it cannot appear in search at all — which is why this report is critical.
The report splits URLs into two groups: "Indexed" and "Not indexed". The latter includes the reasons: noindex tag, canonicalized to another, indexed though blocked, server error, 404, and more. Each reason tells you what to fix.
Review the non-indexed regularly: some are intentional (e.g., thank-you pages), but if important content pages are missing from the index, that is a problem to fix.
- A non-indexed page does not appear in search at all
- Reasons: noindex, canonicalization, server error, 404, blocked
- Check that no important pages are accidentally excluded
- Some exclusions are intentional
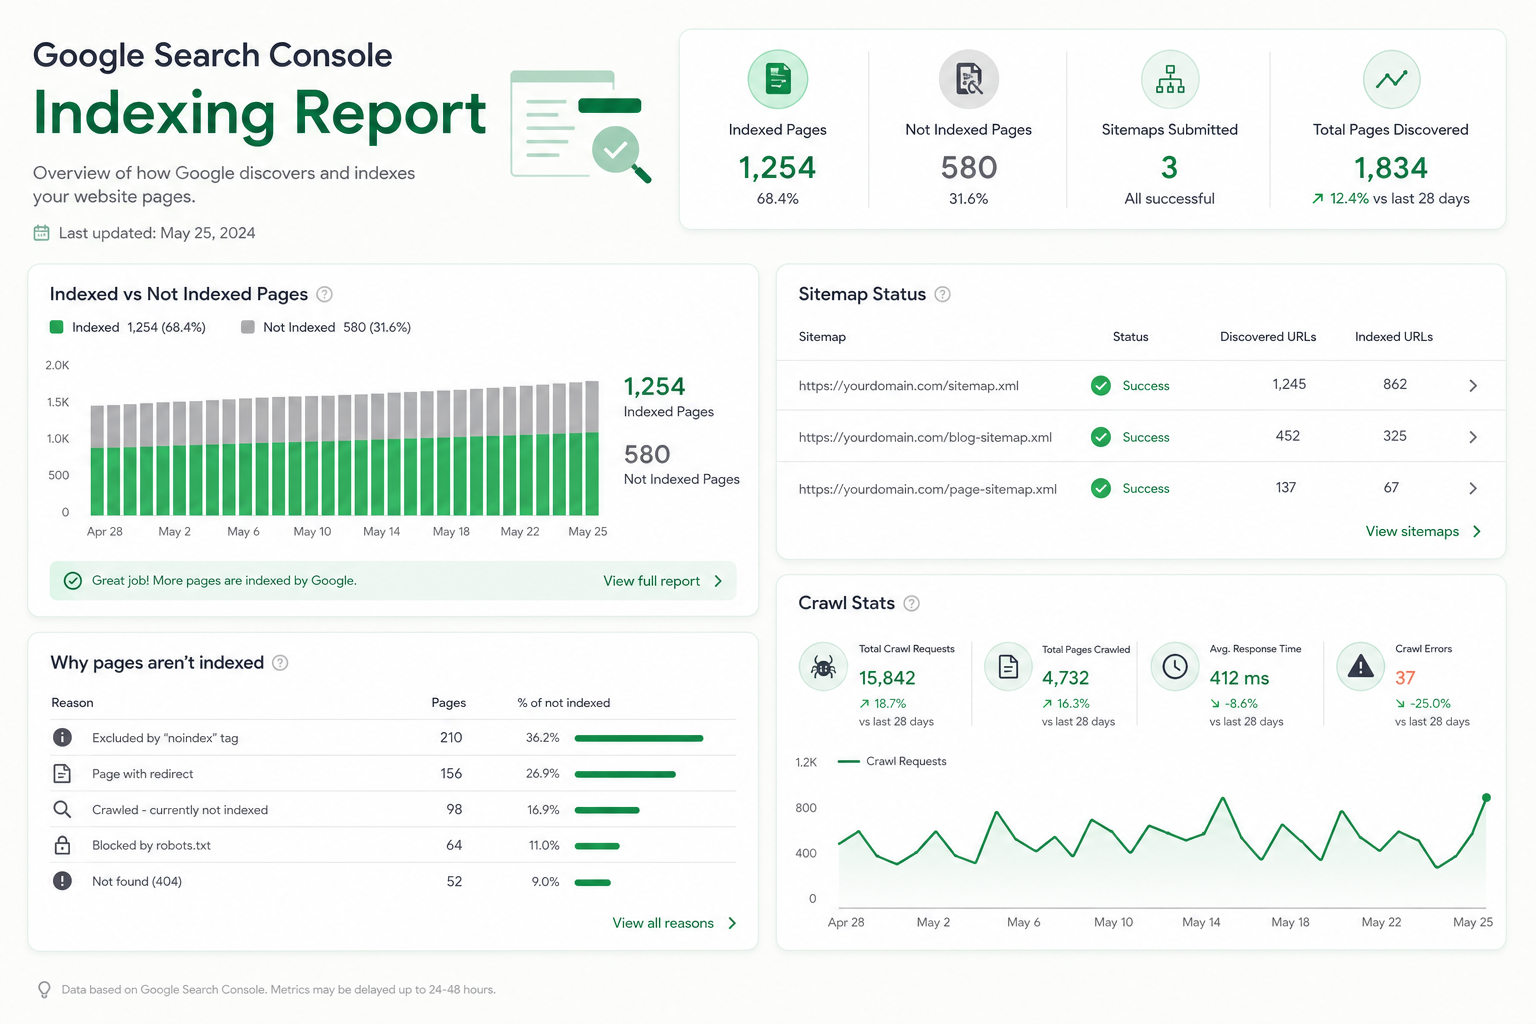
Sitemaps — help Google find your pages
An XML sitemap is a file that lists your site’s important URLs and helps Google find and index them faster. In the Sitemaps section of Search Console you submit the sitemap URL and monitor its status.
A sitemap is especially important for large sites, new sites without a strong link profile, and pages with weak internal linking. It does not guarantee indexing, but it speeds up discovery.
Keep the sitemap up to date: include only indexable, canonical URLs (no noindex or redirect pages). Search Console reports how many of the sitemap URLs have been read and whether there are errors.
- Lists important URLs and speeds up discovery
- Most important for large and new sites
- Include only canonical, indexable URLs
- Submit in GSC and monitor read status and errors
URL inspection tool — diagnose a single page
The URL Inspection tool tells you the exact status of a single address: whether it is indexed, when it was last crawled, what the canonical version is, and whether the page has mobile or structured-data issues.
With the tool you can also request indexing for a new or updated page. The "Request indexing" button speeds up Google’s visit — useful when you publish important content or fix an issue.
Use "Test live URL" to see how Googlebot sees the page right now. This reveals rendering problems and blocks that are not visible in the browser.
- Shows: index status, canonical version, issues
- Request indexing for a new or updated page
- Test how Googlebot sees the page in real time
- Reveals rendering and blocking problems
Other useful reports
Search Console contains several other valuable reports. The Core Web Vitals report groups pages by performance — read more in our Core Web Vitals guide.
Mobile Usability reports mobile issues, Enhancements reports structured-data errors, and Links shows the internal and external links to your site.
Manual Actions and Security Issues are reports that should always be empty. If they have entries, that is a serious problem to fix immediately.
- Core Web Vitals: performance by page group
- Mobile Usability: mobile issues
- Enhancements: structured-data errors
- Links: internal and external links
- Manual Actions: should be empty
Google Search Console in numbers
How to use the data in practice
The value of Search Console is not the data itself but how you use it. Start by finding pages that appear at positions 5–15 — a little optimization often lifts them to the top and brings significant traffic.
Identify high-impression, low-CTR queries: there, the title and meta description are not enticing the click. Improve the titles and watch whether CTR rises. Read more in our on-page SEO guide.
Monitor index status and fix problems immediately. Set yourself a monthly routine: check the performance trend, new indexing errors, Core Web Vitals, and manual actions.
- Lift queries at positions 5–15 to the top
- Improve titles for low-CTR queries
- Fix indexing errors immediately
- Build a monthly review routine
Google Search Console checklist
Run this list when you set up Search Console and during regular monitoring.
Once GSC is in use, connect it to broader SEO work: technical SEO, keyword research, and an SEO audit. Need help? Explore our SEO service.
- Verify ownership (recommended: Domain property)
- Connect to Google Analytics 4
- Submit an XML sitemap and confirm read status
- Check index status — no important pages excluded
- Monitor the performance report and four metrics
- Check Core Web Vitals and manual actions
- Set a monthly monitoring routine
Frequently asked questions
What is Google Search Console?
Google Search Console is Google’s free tool that shows how your site performs in search: which queries it appears for, how many clicks it earns, which pages are indexed, and whether there are technical problems.
What is the difference between Search Console and Google Analytics?
Search Console focuses on what happens in search before the click (queries, impressions, positions). Google Analytics measures visitor behavior on the site after the click. They complement each other.
How do I verify site ownership?
You can verify ownership as a Domain property (with a DNS record, covers all subdomains) or as a URL prefix (HTML file, meta tag, or GA connection). We recommend the Domain property for coverage.
Why does my page not appear in Google Search Console?
The most common reasons are blocked indexing (noindex tag or robots.txt), canonicalization to another URL, a server error, or Google not having found the page yet. Check the status with the URL Inspection tool and request indexing if needed.
How often should I monitor Search Console?
Do at least a monthly review: performance trends, new indexing errors, Core Web Vitals, and manual actions. During larger changes or problem situations, monitor more frequently, even weekly.