ROI vs ROAS: what each tells you
ROAS (Return on Ad Spend) = ad revenue ÷ ad spend. It shows one channel's efficiency — Google Ads ROAS 400% means €4 return per ad euro. ROI (Return on Investment) = (return − cost) ÷ cost — it covers all marketing and business profitability.
ROAS can look good but ROI poor: if conversions are low quality, sales cycles long, or margins low. Leadership gets ROI and revenue impact — not channel ROAS alone.
North star metric connects ROAS and ROI: e.g. new customers, pipeline value, or e-commerce revenue. Channel ROAS serves optimization; north star serves strategy.
Margin matters for ROI: ROAS 500% on low-margin products may still lose money after COGS, shipping, and returns. E-commerce should calculate contribution margin ROAS; B2B should tie marketing cost to closed-won revenue, not MQL volume alone.
Report both leading and lagging indicators: channel ROAS and CPL are leading; pipeline created, win rate, and revenue are lagging. Leadership needs lagging outcomes; channel managers need leading signals — one dashboard can show both layers.
Benchmark ROI against prior year and plan — not vanity targets. If marketing spend rose 25% but pipeline rose 10%, the conversation is efficiency, not celebration. Honest reporting builds trust with finance and unlocks smarter budget debates.
Attribution: who gets credit
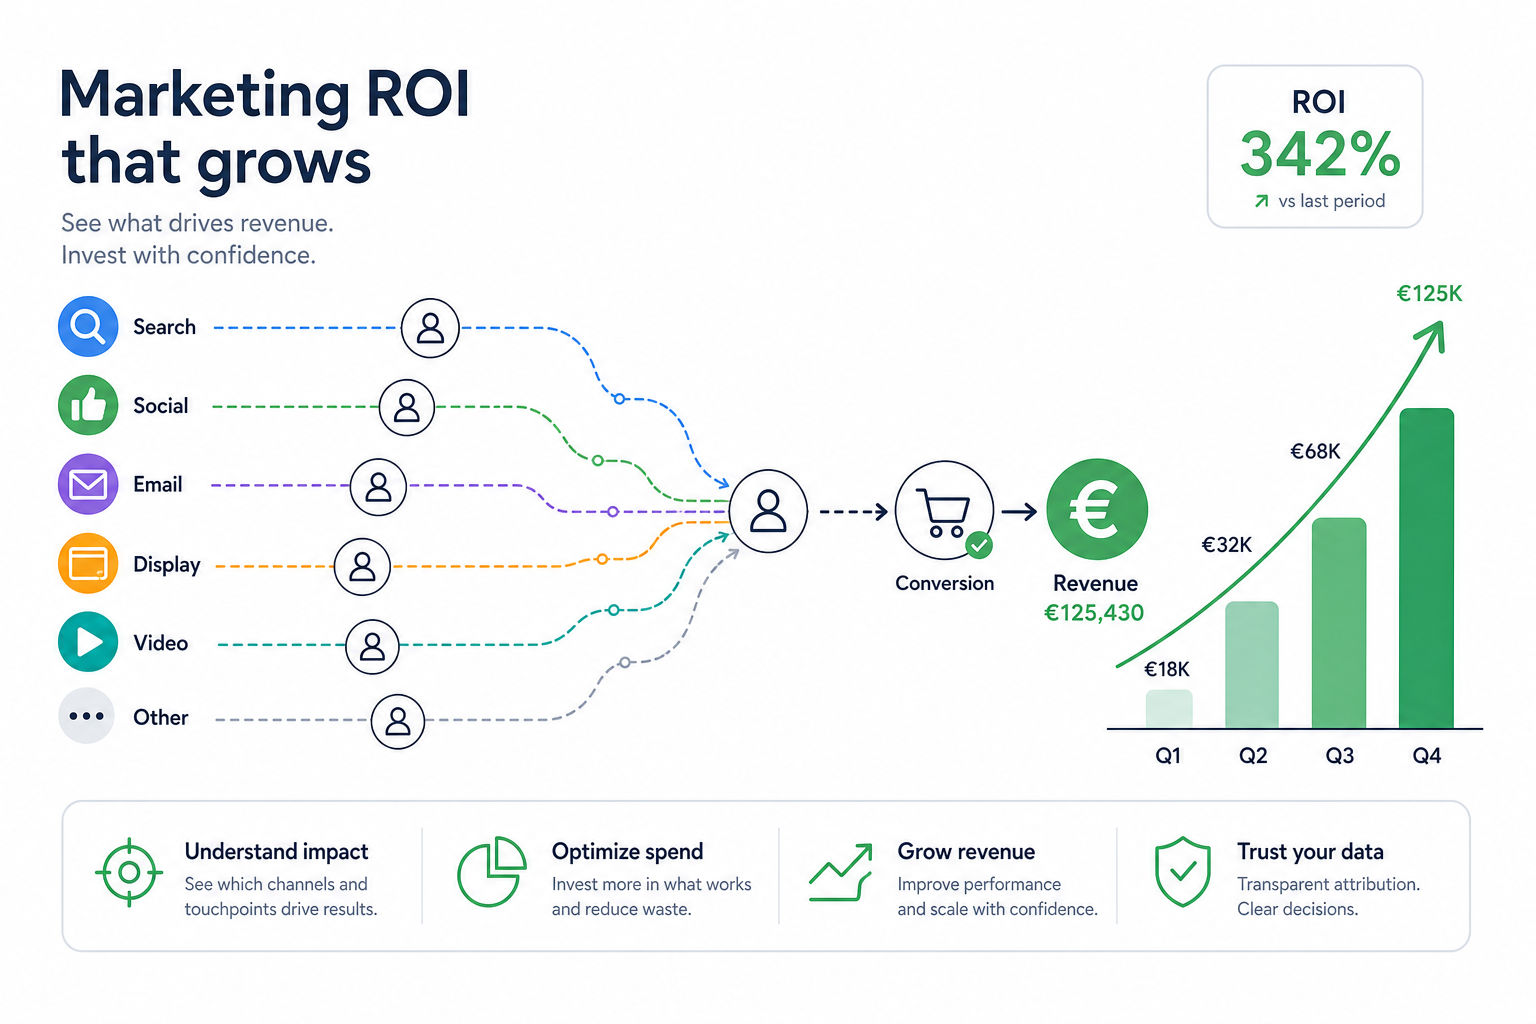
Customers pass through multiple channels before converting: Meta opens, SEO reinforces, Search converts. Attribution assigns value to channels — first-click, last-click, or data-driven. Last-click favors Search, first-click Meta; truth is in between.
Data-driven attribution (Google, Meta) assigns value by path — better than simple last-click. Cross-channel attribution needs unified data: GA4, CRM, and ad platforms. See cross-channel attribution.
Attribution is not perfect — it is the best estimate. What matters is one consistent model across the organization, not different truths per channel.
Offline and CRM stages extend attribution: a Meta lead that closes three months later in Salesforce must link back to source. Without CRM integration, Search and brand get over-credited and upper-funnel channels get cut prematurely.
Incrementality tests (geo holdout, paused spend tests) validate attribution models when budget is large enough. Even simple before/after tests on Meta pauses reveal whether reported ROAS matches business revenue.
- First-click: opening channel gets value
- Last-click: converting channel gets value
- Data-driven: path shares value
- Consistent model for the whole team
Dashboard and tracking
Dashboard unifies channels in one view: leads, conversions, CAC, ROAS per channel, pipeline, and revenue. Without a dashboard reporting is manual and error-prone.
Minimum requirements: GA4 conversion tracking, UTM tags, CRM integration, ad platform conversion import. Google Ads and Meta conversion tracking must work before attribution.
Monthly dashboard: channel performance, trends, anomalies, and actions. Quarterly QBR for deeper analysis and budget reallocation.
Define conversion events once: form submit, demo booked, purchase, qualified lead. Map each to GA4, ad platforms, and CRM with the same naming. Duplicate or misnamed events are the most common reason dashboards disagree with finance.
Anomaly rules save time: alert when CAC rises 30% week-over-week, when conversion rate drops on a key landing page, or when spend runs without conversions for 48 hours. A dashboard nobody checks weekly is decoration — assign an owner and a review slot.
Leadership reporting
Leadership gets business outcomes, not clicks: new customers, pipeline, revenue, CAC, ROI, and trends. One page is enough — nobody reads 20 KPIs.
Report structure: summary (3 bullets), north star metric, channel overview, anomalies, and recommended actions. Visual dashboards (Looker, Sheets) speed reading.
QBR (Quarterly Business Review) quarterly: strategic review, OKR progress, budget reallocation, and next quarter priorities. Read marketing plan and calendar.
Executive summaries should answer three questions: Are we hitting the north star? Which channel moved most? What do we do next quarter? Charts without recommended actions delay decisions — every QBR slide should tie to budget or campaign change.
Finance and marketing alignment closes the ROI loop: marketing reports pipeline and revenue marketing influenced; finance validates against closed-won and margin. Shared definitions of "marketing-sourced" vs "marketing-influenced" prevent quarterly arguments.

Full Stack measurement: one truth
Separate agencies report their channel ROAS — nobody owns total ROI. AlgoTerra Full Stack combines Google Ads, Meta, SEO, and GEO into one dashboard and reporting.
Execution: shared dashboard, cross-channel attribution, monthly report, and quarterly QBR for leadership. Measurement improves when channels share data instead of competing on reports.
Start with a free audit: we map tracking, attribution, and reporting. Then we build dashboard and reporting process.
Full Stack measurement means one team owns GA4, ad conversion import, CRM fields, and the Looker or Sheets dashboard — not three vendors each exporting their own CSV. Single ownership fixes gaps within weeks, not quarters.
We deliver monthly leadership one-pagers and quarterly QBR decks with competitive and channel context. Free audit identifies the biggest measurement gaps first.
Common measurement mistakes
We see these in audits — and they distort ROI for quarters. Fixing CRM integration and one attribution model often changes budget priorities overnight.
- ROAS only to leadership → optimize channels, not business
- Last-click for everything → Meta and SEO undervalued
- No CRM integration → leads missing from pipeline
- 20 KPIs in report → nobody reads, decisions delay
- No quarterly rhythm → data accumulates, no action
Frequently asked questions
What is the difference between ROI and ROAS?
ROAS measures ad channel return vs ad spend. ROI measures overall marketing profitability vs all costs. Leadership gets ROI; channels are optimized with ROAS.
Which attribution model is best?
Data-driven is often best — it assigns value by path. What matters is one consistent model across the organization, not different truths per channel.
What do I report to leadership?
Business outcomes: new customers, pipeline, revenue, CAC, ROI. One page, north star metric, channel summary, and actions.
How do I build a dashboard?
GA4 conversions, UTM tags, CRM integration, ad platform import. Shared dashboard for channels. Audit reveals gaps.
How does AlgoTerra help with measurement?
A free audit maps tracking. Full Stack unifies channels into one dashboard and QBR reporting.